
MARKET AND REVENUE CURVES - ALL NUMERICAL PROBLEM AND SOLUTION
This article contains all numerical problems and their solutions for class 12 economics, chapter 2 (MARKET AND REVENUE CURVES). These numerals are extremely important for the examination.
Problem 1
If a business firm sells 20 units of orange at per unit price Rs. 40, find total revenue.
Solution
Given
Price per unit (P) = Rs. 40
Quantity sold (Q) = 20 units
We know that
Total revenue (TR)
= P X Q
= 40 × 20
= Rs. 800
Problem 2
If the total revenue of a firm from the sale of 50 apples is Rs. 2,500, then find average revenue.
Solution
Given
Total revenue (TR) = Rs. 2,500
Quantity sold (Q) = 50 units
Average revenue (AR)
= TR / Q
= 2,500 / 50
= Rs. 50
Problem 3
If the total revenue received from sale of 20 units and 21 units of mango are Rs. 400 and Rs. 1,600 respectively, find marginal revenue.
Solution
Given
Revenue from the sale of 20 units of mango (TR₁) = Rs. 400
Revenue from the sale of 21 units of mango (TR₂) = Rs. 1,600
Marginal revenue (MR) = TR₂ - TR₁ = 1,600 - 400 = Rs. 1,200
Alternative Method
Change in total revenue (ΔTR) = TR₂ - TR₁
= 1,600 - 400
= Rs. 1,200
Change in quantity sold (ΔQ) = Q₂ - Q₁
= 21 - 20
= 1 units
Marginal revenue (MR)
= ΔTR / ΔQ
= 1,200 / 1
= Rs. 1,200
Problem 4
If the total revenue received by a firm from sale of 10 piece and 20 piece of apple are Rs. 1,000 and Rs. 2,000 respectively, then find marginal revenue.
Solution
Given
Initial total revenue (TR₁) = Rs. 1,000
New total revenue (TR₂) = Rs. 2,000
Change in total revenue (ΔTR) = TR₂ - TR₁ = 2,000 - 1,000 = Rs. 1,000
Initial quantity sold (Q₁) = 10 pieces
New quantity sold (Q₂) = 20 pieces
Change in quantity sold (ΔQ) = Q₂ - Q₁ = 20 - 10 = 10 piece
Marginal revenue (MR) = ΔTR / ΔQ
= 1,000 / 10
= Rs. 100
Problem 5
Complete the following table.
Solution
Problem 6
Complete the following table and derive TR, AR, and MR curves. What type of market does it represent?
Solution
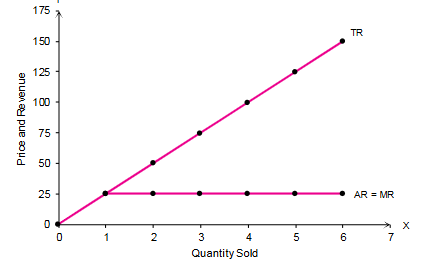
In the above figure, with AR and MR curves are horizontal and overlapping each other. Therefore, it represents perfect competition.
Problem 7
Complete the table by computing the total revenue (TR) average revenue (AR) and marginal revenue (MR). Also draw the TR, AR and MR curves in a diagram and explain their nature.
Solution
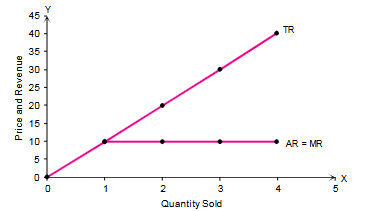
In figure, TR is the total revenue curve. It increases in the same proportion as there is increase in the quantity sold. AR is the average revenue curve. It is a horizontal straight line parallel to the X-axis. It starts from a fixed intercept on the Y-axis which is equal to price (Rs. 10). It coincides with the price line or demand curve, i.e. AR = P = D. MR curve is also a horizontal straight line parallel to X-axis. Since AR is constant, MR is also constant. MR curve coincides with the AR curve, i.e. AR = MR = P = D.
Problem 8
Find out the total revenue, average revenue and marginal revenue.
Solution
Problem 9
Complete the following table and drive TR, AR, MR curves. What type of market does it represent?
Solution

Since, AR and MR curves are sloping downward; this represents imperfect competitions or monopoly.